The iFanboy.com Comic Book Podcast is a weekly talk show all about the best new current comic book releases. Lifelong friends, Conor Kilpatrick and Josh Flanagan talk about what they loved and (sometimes) hated in the current weekly books, from publishers like Marvel, DC, Image Comics, Dark Horse Comics, BOOM! Studios, IDW, Aftershock, Valiant, and more. The aim is to have a fun time, some laughs, but to also really understand what makes comic books work and what doesn’t, and trying to under ...
…
continue reading
Content provided by Enrico Bertini and Moritz Stefaner, Enrico Bertini, and Moritz Stefaner. All podcast content including episodes, graphics, and podcast descriptions are uploaded and provided directly by Enrico Bertini and Moritz Stefaner, Enrico Bertini, and Moritz Stefaner or their podcast platform partner. If you believe someone is using your copyrighted work without your permission, you can follow the process outlined here https://player.fm/legal.
Similar to Data Stories
The PetaPixel Podcast is a twice-weekly podcast about the wonderful world of photography. It’s a fusion of news, opinions, humor, and real-world experience, bundled into a show that you can listen to on your way to work. Subscribe today to stay up to date with what’s going on in the photo industry from one of the-most-listened-to photography podcasts. Join thousands of photographers from around the world who enjoy host Sharky James' twice-weekly photo podcast where you'll have fun, improve y ...
…
continue reading
Welcome to the FroKnowsPhoto Podcast where we discuss all things Photography. From Nikon to Canon Cameras and all the lenses and accessories for your camera bag. If you are into photography looking to pick up tips, tricks, reviews and our personal views than this is the podcast for you. Please subscribe for the latest episodes.
…
continue reading
1
Game of Owns - A Song of Ice and Fire/House of the Dragon/Game of Thrones podcast
Hannah Hosking and Zack Luye
Podcasting through George R.R. Martin's A Song of Ice and Fire/House of the Dragon and HBO's Game Of Thrones. Episodes sorted chapter by chapter at gameofowns.com
…
continue reading
Three thousand years after a chunk of iron the size of Khufu’s pyramid collides with Europa, Jupiter’s sixth moon, an asteroid borne of the collision crashes into Earth’s Arctic ice shelf carrying extraterrestrial microbial life. The first man to come into contact with the microbes hears voices—and then dies. After determining the meteorite originated from Europa, the Global Exploratory Corporation sends oceanographer and biologist, Kathy Connelly, and her crew to the moon aboard the Surveyo ...
…
continue reading
The Modern Art Notes Podcast is a weekly, hour-long interview program featuring artists, historians, authors, curators and conservators. Pulitzer Prize-winning art critic Sebastian Smee called The MAN Podcast “one of the great archives of the art of our time.” When the US chapter of the International Association of Art Critics gave host Tyler Green one of its inaugural awards for criticism in 2014, it included a special citation for The MAN Podcast.
…
continue reading
Read along with the Sword and Laser book club! From classic science fiction to the latest gritty fantasy, we cover it. Subscribe for book discussions, author interviews, hot releases, and news from the genre fiction world!
…
continue reading
A weekly comic book podcast by fans for fans. Reviews, discussions, news, contests and more.
…
continue reading
Comic Geek Speak is the best podcast about comic books for fans and new readers alike. Put together by a group of life-long comic geeks, it's 4-5 hours a week of comic book history, current comic news, and a general look at the industry. In addition to all the latest in comics talk, the show also features creator interviews, listener responses, contests, and trivia, lots of trivia. So listen in and experience all the joys of a Wednesday afternoon at the comic shop, from the comfort of your o ...
…
continue reading
Player FM - Podcast App
Go offline with the Player FM app!
Go offline with the Player FM app!

))
065 | What Happened in Vis in 2015? Year Review with Andy Kirk and Robert Kosara
Archived series ("Inactive feed" status)
When?
This feed was archived on March 07, 2022 08:07 (
Why? Inactive feed status. Our servers were unable to retrieve a valid podcast feed for a sustained period.
What now? You might be able to find a more up-to-date version using the search function. This series will no longer be checked for updates. If you believe this to be in error, please check if the publisher's feed link below is valid and contact support to request the feed be restored or if you have any other concerns about this.
Manage episode 121244233 series 50392
Content provided by Enrico Bertini and Moritz Stefaner, Enrico Bertini, and Moritz Stefaner. All podcast content including episodes, graphics, and podcast descriptions are uploaded and provided directly by Enrico Bertini and Moritz Stefaner, Enrico Bertini, and Moritz Stefaner or their podcast platform partner. If you believe someone is using your copyrighted work without your permission, you can follow the process outlined here https://player.fm/legal.

Hey yo!
Another turn of the year is approaching and we take some time to reflect with our classic guests Andy Kirk and Robert Kosara on what has happened in 2015: “What where the major trends? Big debates? Best visualizations? New tools? Etc.” We’ve even put our predictions in writing — you can read them in our transcript of this episode here.
This was a great year for Data Stories, with a total of 22 episodes (our record so far!). We want to thank our fantastic collaborators Destry and Florian for their great support with running the show, our guests for spending time talking with us, and of course all of you for listening to Data Stories!
Happy 2016! Enjoy the holidays and we’ll see you on January with a ton of new stuff from our side. Stay tuned!
Data Stories is brought to you by Qlik, who allows you to explore the hidden relationships within your data that lead to meaningful insights. Check out a new blog post from the Qlik Blog called “People Are Smart: Data Literacy and Broad Audiences”. As you may know Data Literacy is a subject we love to talk about! 
Most popular episodes
- Data Stories #56: Amanda Cox on Working With R, NYT Projects, Favorite Data
- Data Stories #52: Science Communication at SciAm w/ Jen Christiansen
- Data Stories #57: Visualizing Human Development w/ Max Roser[a]
Major Trends Of 2015
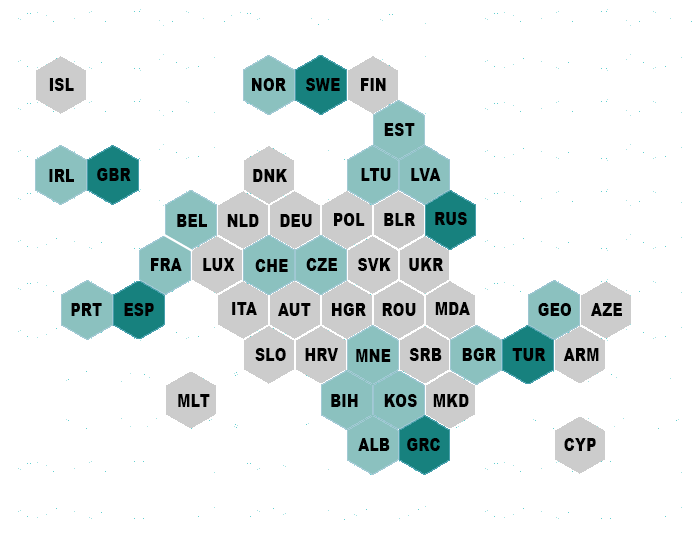
Cartogram, NPR
- Cartograms, gridded maps (Collection of links in first item here, Hexmaps, London map, Bear map)
- Machine learning / image processing, etc. (e.g. use of satellite images)
- 3D and VR (NYT Cardboard Experiment)
- Better storytelling
- Data podcasts
- Mobile vis
Major Debates/Issues

Design/Redesign
- Vis ethics: debate on aesthetizing negative data — and Sarah Slobin’s recommendations
- Data visualization criticism – Design/redesign article
- The Stephen Few / Alberto Cairo / David Mccandleuss debate
- Stephen Few’s Visualization research a pseudoscience
- Dogmatic rules vs. flexibility
Great New Visualizations

understanding neural networks through deep visualization
- Dear Data
- Hear our episode with Dear Data
- Pace of social change
- 100 years of Tax Brackets
- Draw how family income affects children’s college chances
- Visualization of what neural networks see “Inceptionism: Going Deeper into Neural Networks” and “Understanding Neural Networks Through Deep Visualization”
- What’s really warming the world?
- Network effect
- Seagull sky trails
- What Happens When the Fed Raises Rates, In One Rube Goldberg Machine
Research/Academic Developments
CONNECTED SCATTER PLOT STUDY BY HAROZ, KOSARA AND FRANCONERI
- Papers on presentation-related topics (ISOTYPE, Connected Scatterplot, Bar chart embellishments)
- ISOTYPE: http://steveharoz.com/research/isotype/
- Connected Scatterplot: http://steveharoz.com/research/connected_scatterplot/
- Bar chart Embellishments: http://kosara.net/papers/2015/Skau-EuroVis-2015.pdf
- Enrico’s deceiving vis paper at CHI
- Borkin et al. on Memorability at VIS
- Hear our episode on the IEEE VIS ’15 Conference
- Seeing Data – Visualisation Literacy
- How do People Make Sense of Unfamiliar Visualization? A Grounded Model of Novice’s Information Visualization Sensemaking by Sukwon Lee, Sung-Hee Kim, Ya-Hsin Hung, Heidi Lam, Youn-ah Kang, and Ji Soo Yi
- Personal visualization: e.g. http://hcitang.org/papers/2015-tvcg-pva.pdf and http://www.computer.org/csdl/mags/cg/preprint/07106391.pdf
Notable People, Companies, Studios

Domestic Data streamers
- Bostock leaving NYT, Shan Carter, the rising star of Gregor Aisch
- Chad Skelton leaving Vancouver Sun
- Notable appointments at FT (Alan Smith OBE)
- London: After the flood, Signal/Noise, Tekja
- Domestic Data Streamers
- Hear our episode on Domestic Data Streamers
New Books
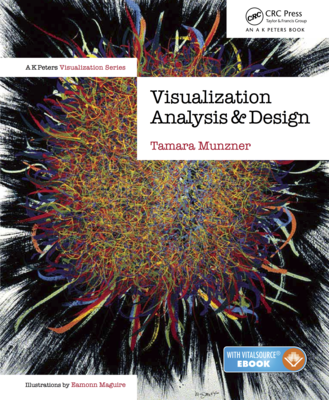
- Tamara Munzner, Visualization Analysis and Design
- Hear our episode with Tamara Munzner
- Stephanie Evergreen, Presenting Data Effectively: Communicating Your Findings for Maximum Impact
- Cole Nussbaumer Knaflic, Storytelling with Data
New titles coming up:
- Andy Kirk’s new book “Data Visualisation: A Handbook for Data-Driven Design”, May 2016
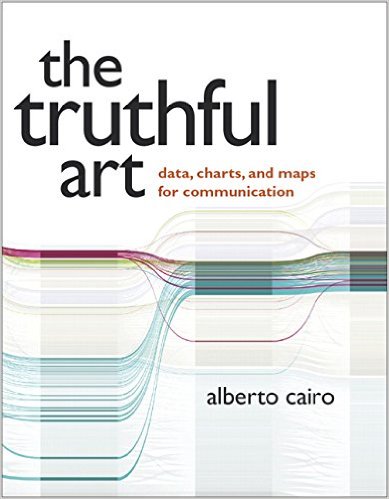
- Alberto Cairo’s new book “The Truthful Art”
- Hear our episode with Alberto Cairo and Robert Kosara
- Dear Data book (September 2016)
Blogs

visualising data BLOG
- This guy Andy’s website (Kantar Information Is Beautiful Award)
- Visual Complexity – 10 years! 1000 projects!
- Reddit AMAs (Alberto, Tamara, Robert, Nate Silver, Hadley Wickham, David McCandless, Nathan Yau, Mike Bostock)
- Eagereyes (not new but still awesome)
- Flowingdata
Podcasts

Software / Libraries / Tools

VOYAGER VISUALIZATION TOOL DEVELOPED AT IDL FROM UW

- Vizable
- The end of Many Eyes
- Vega, Vegalite, etc. vs. D3
- Brunel
- Voyager and related tools
- Trifacta Data Wrangling tool
- React.js
- Mapzen, CartoDB, Mapbox
Events and specific talks

What was your highlight?
- OpenVis Conference
- Visualized
- resonate
- art+bits
- Tapestry
- Loops talk by Lena Groeger
What’s next in 2016? Wishes?
- Our expectations from last year’s edition
Happy New Year Everyone!
Related episodes
Chapters
1. Outtakes (00:00:00)
2. Qlik ad (00:00:30)
3. Hello and welcome to our guests (00:01:30)
4. The year for data stories (00:02:05)
5. Major trends (00:04:30)
6. Big debates (00:14:00)
7. Visualizations of note (00:23:00)
8. Academic Developments (00:28:04)
9. Qlik ad (00:37:28)
10. People, Companies, Studios (00:39:36)
11. Books (00:42:20)
12. Blogs (00:49:15)
13. Podcasts (00:56:20)
14. Software, libraries, and tools (00:58:00)
15. Events and talks (01:05:30)
16. Predictions for 2016 (01:09:50)
17. Qlik ad (01:15:55)
166 episodes
Archived series ("Inactive feed" status)
When?
This feed was archived on March 07, 2022 08:07 (
Why? Inactive feed status. Our servers were unable to retrieve a valid podcast feed for a sustained period.
What now? You might be able to find a more up-to-date version using the search function. This series will no longer be checked for updates. If you believe this to be in error, please check if the publisher's feed link below is valid and contact support to request the feed be restored or if you have any other concerns about this.
Manage episode 121244233 series 50392
Content provided by Enrico Bertini and Moritz Stefaner, Enrico Bertini, and Moritz Stefaner. All podcast content including episodes, graphics, and podcast descriptions are uploaded and provided directly by Enrico Bertini and Moritz Stefaner, Enrico Bertini, and Moritz Stefaner or their podcast platform partner. If you believe someone is using your copyrighted work without your permission, you can follow the process outlined here https://player.fm/legal.
Hey yo!
Another turn of the year is approaching and we take some time to reflect with our classic guests Andy Kirk and Robert Kosara on what has happened in 2015: “What where the major trends? Big debates? Best visualizations? New tools? Etc.” We’ve even put our predictions in writing — you can read them in our transcript of this episode here.
This was a great year for Data Stories, with a total of 22 episodes (our record so far!). We want to thank our fantastic collaborators Destry and Florian for their great support with running the show, our guests for spending time talking with us, and of course all of you for listening to Data Stories!
Happy 2016! Enjoy the holidays and we’ll see you on January with a ton of new stuff from our side. Stay tuned!
Data Stories is brought to you by Qlik, who allows you to explore the hidden relationships within your data that lead to meaningful insights. Check out a new blog post from the Qlik Blog called “People Are Smart: Data Literacy and Broad Audiences”. As you may know Data Literacy is a subject we love to talk about!
Most popular episodes
- Data Stories #56: Amanda Cox on Working With R, NYT Projects, Favorite Data
- Data Stories #52: Science Communication at SciAm w/ Jen Christiansen
- Data Stories #57: Visualizing Human Development w/ Max Roser[a]
Major Trends Of 2015
Cartogram, NPR
- Cartograms, gridded maps (Collection of links in first item here, Hexmaps, London map, Bear map)
- Machine learning / image processing, etc. (e.g. use of satellite images)
- 3D and VR (NYT Cardboard Experiment)
- Better storytelling
- Data podcasts
- Mobile vis
Major Debates/Issues
Design/Redesign
- Vis ethics: debate on aesthetizing negative data — and Sarah Slobin’s recommendations
- Data visualization criticism – Design/redesign article
- The Stephen Few / Alberto Cairo / David Mccandleuss debate
- Stephen Few’s Visualization research a pseudoscience
- Dogmatic rules vs. flexibility
Great New Visualizations
understanding neural networks through deep visualization
- Dear Data
- Hear our episode with Dear Data
- Pace of social change
- 100 years of Tax Brackets
- Draw how family income affects children’s college chances
- Visualization of what neural networks see “Inceptionism: Going Deeper into Neural Networks” and “Understanding Neural Networks Through Deep Visualization”
- What’s really warming the world?
- Network effect
- Seagull sky trails
- What Happens When the Fed Raises Rates, In One Rube Goldberg Machine
Research/Academic Developments
CONNECTED SCATTER PLOT STUDY BY HAROZ, KOSARA AND FRANCONERI
- Papers on presentation-related topics (ISOTYPE, Connected Scatterplot, Bar chart embellishments)
- ISOTYPE: http://steveharoz.com/research/isotype/
- Connected Scatterplot: http://steveharoz.com/research/connected_scatterplot/
- Bar chart Embellishments: http://kosara.net/papers/2015/Skau-EuroVis-2015.pdf
- Enrico’s deceiving vis paper at CHI
- Borkin et al. on Memorability at VIS
- Hear our episode on the IEEE VIS ’15 Conference
- Seeing Data – Visualisation Literacy
- How do People Make Sense of Unfamiliar Visualization? A Grounded Model of Novice’s Information Visualization Sensemaking by Sukwon Lee, Sung-Hee Kim, Ya-Hsin Hung, Heidi Lam, Youn-ah Kang, and Ji Soo Yi
- Personal visualization: e.g. http://hcitang.org/papers/2015-tvcg-pva.pdf and http://www.computer.org/csdl/mags/cg/preprint/07106391.pdf
Notable People, Companies, Studios
Domestic Data streamers
- Bostock leaving NYT, Shan Carter, the rising star of Gregor Aisch
- Chad Skelton leaving Vancouver Sun
- Notable appointments at FT (Alan Smith OBE)
- London: After the flood, Signal/Noise, Tekja
- Domestic Data Streamers
- Hear our episode on Domestic Data Streamers
New Books
- Tamara Munzner, Visualization Analysis and Design
- Hear our episode with Tamara Munzner
- Stephanie Evergreen, Presenting Data Effectively: Communicating Your Findings for Maximum Impact
- Cole Nussbaumer Knaflic, Storytelling with Data
New titles coming up:
- Andy Kirk’s new book “Data Visualisation: A Handbook for Data-Driven Design”, May 2016
- Alberto Cairo’s new book “The Truthful Art”
- Hear our episode with Alberto Cairo and Robert Kosara
- Dear Data book (September 2016)
Blogs
visualising data BLOG
- This guy Andy’s website (Kantar Information Is Beautiful Award)
- Visual Complexity – 10 years! 1000 projects!
- Reddit AMAs (Alberto, Tamara, Robert, Nate Silver, Hadley Wickham, David McCandless, Nathan Yau, Mike Bostock)
- Eagereyes (not new but still awesome)
- Flowingdata
Podcasts
Software / Libraries / Tools
VOYAGER VISUALIZATION TOOL DEVELOPED AT IDL FROM UW
- Vizable
- The end of Many Eyes
- Vega, Vegalite, etc. vs. D3
- Brunel
- Voyager and related tools
- Trifacta Data Wrangling tool
- React.js
- Mapzen, CartoDB, Mapbox
Events and specific talks
What was your highlight?
- OpenVis Conference
- Visualized
- resonate
- art+bits
- Tapestry
- Loops talk by Lena Groeger
What’s next in 2016? Wishes?
- Our expectations from last year’s edition
Happy New Year Everyone!
Related episodes
Chapters
1. Outtakes (00:00:00)
2. Qlik ad (00:00:30)
3. Hello and welcome to our guests (00:01:30)
4. The year for data stories (00:02:05)
5. Major trends (00:04:30)
6. Big debates (00:14:00)
7. Visualizations of note (00:23:00)
8. Academic Developments (00:28:04)
9. Qlik ad (00:37:28)
10. People, Companies, Studios (00:39:36)
11. Books (00:42:20)
12. Blogs (00:49:15)
13. Podcasts (00:56:20)
14. Software, libraries, and tools (00:58:00)
15. Events and talks (01:05:30)
16. Predictions for 2016 (01:09:50)
17. Qlik ad (01:15:55)
166 episodes
All episodes
×Welcome to Player FM!
Player FM is scanning the web for high-quality podcasts for you to enjoy right now. It's the best podcast app and works on Android, iPhone, and the web. Signup to sync subscriptions across devices.
Similar to Data Stories
The iFanboy.com Comic Book Podcast is a weekly talk show all about the best new current comic book releases. Lifelong friends, Conor Kilpatrick and Josh Flanagan talk about what they loved and (sometimes) hated in the current weekly books, from publishers like Marvel, DC, Image Comics, Dark Horse Comics, BOOM! Studios, IDW, Aftershock, Valiant, and more. The aim is to have a fun time, some laughs, but to also really understand what makes comic books work and what doesn’t, and trying to under ...
…
continue reading
The PetaPixel Podcast is a twice-weekly podcast about the wonderful world of photography. It’s a fusion of news, opinions, humor, and real-world experience, bundled into a show that you can listen to on your way to work. Subscribe today to stay up to date with what’s going on in the photo industry from one of the-most-listened-to photography podcasts. Join thousands of photographers from around the world who enjoy host Sharky James' twice-weekly photo podcast where you'll have fun, improve y ...
…
continue reading
Welcome to the FroKnowsPhoto Podcast where we discuss all things Photography. From Nikon to Canon Cameras and all the lenses and accessories for your camera bag. If you are into photography looking to pick up tips, tricks, reviews and our personal views than this is the podcast for you. Please subscribe for the latest episodes.
…
continue reading
1
Game of Owns - A Song of Ice and Fire/House of the Dragon/Game of Thrones podcast
Hannah Hosking and Zack Luye
Podcasting through George R.R. Martin's A Song of Ice and Fire/House of the Dragon and HBO's Game Of Thrones. Episodes sorted chapter by chapter at gameofowns.com
…
continue reading
Three thousand years after a chunk of iron the size of Khufu’s pyramid collides with Europa, Jupiter’s sixth moon, an asteroid borne of the collision crashes into Earth’s Arctic ice shelf carrying extraterrestrial microbial life. The first man to come into contact with the microbes hears voices—and then dies. After determining the meteorite originated from Europa, the Global Exploratory Corporation sends oceanographer and biologist, Kathy Connelly, and her crew to the moon aboard the Surveyo ...
…
continue reading
The Modern Art Notes Podcast is a weekly, hour-long interview program featuring artists, historians, authors, curators and conservators. Pulitzer Prize-winning art critic Sebastian Smee called The MAN Podcast “one of the great archives of the art of our time.” When the US chapter of the International Association of Art Critics gave host Tyler Green one of its inaugural awards for criticism in 2014, it included a special citation for The MAN Podcast.
…
continue reading
Read along with the Sword and Laser book club! From classic science fiction to the latest gritty fantasy, we cover it. Subscribe for book discussions, author interviews, hot releases, and news from the genre fiction world!
…
continue reading
A weekly comic book podcast by fans for fans. Reviews, discussions, news, contests and more.
…
continue reading
Comic Geek Speak is the best podcast about comic books for fans and new readers alike. Put together by a group of life-long comic geeks, it's 4-5 hours a week of comic book history, current comic news, and a general look at the industry. In addition to all the latest in comics talk, the show also features creator interviews, listener responses, contests, and trivia, lots of trivia. So listen in and experience all the joys of a Wednesday afternoon at the comic shop, from the comfort of your o ...
…
continue reading
Player FM - Podcast App
Go offline with the Player FM app!
Go offline with the Player FM app!