))
Coins, Colonists, and Cost Recovery
Manage episode 411322567 series 2805499
Content provided by Mean, Median, and Moose. All podcast content including episodes, graphics, and podcast descriptions are uploaded and provided directly by Mean, Median, and Moose or their podcast platform partner. If you believe someone is using your copyrighted work without your permission, you can follow the process outlined here https://player.fm/legal.
This edition of Mean, Median and Moose, we look at discontinued data sets!
Canada Year Book
Less of a data set, more of a product, is Statistic Canada’s annual Canada Year Book, in production from 2006 to 2012. Funny enough, this seems to have been a previously discontinued but revived product that was discontinued again, as it’s also available from 1867 to 1990! Billed as “the premier reference on the social and economic life of Canada and its citizens”, each year book is presented in almanac style with more than 500 pages of tables, charts, and analytical articles on every major area of Statistics Canada’s expertise. This was fondly used as a reference in many a high school research project.
The idea is, you can click on any of the chapters, ranging from “Business performance and ownership” to “Families, households, and housing” to “Prices and price indexes” and get a quick snapshot of Canadian life as it related to the topic that year. This made for a great quick-reference resource and one that could make for a fantastic starting point for exploring data and history, particularly for students.
It is interesting to see how the year books changed over the years, even from just 2006 to 2012. For example, 2006’s “Education” chapter provided much more commentary than 2012’s Education chapter, commenting generally on schools’ serving special needs students, the denominational system and its abandonment and uptake by province, immigrants lifting the education level in Canada, and the financing of education. In contrast, 2012’s Education chapter simply lists statistics on student enrolment, graduation, tuition costs, and adult training, with little narrative behind these statistics. Particularly eye-catching given the current tuition situation in the 2006 chapter is: “Undergraduate tuition fees have almost tripled since the early 1990s. In 2004/2005, university tuition fees averaged $4,172, compared with $1,464 in 1990/1991.” Seems university tuition has been on a steady rise even longer than our memories might allow, reaching an average of $5,366 in 2012 according to that year’s Year Book.
Another interesting event to see reflected in the series? The 2008 Recession, featured prominently in the 2009 “Business performance and ownership” chapter, the “Economic accounts” chapter, the “Income, pensions, spending and wealth” chapter, and many others. Again, this earlier Year Book takes more of a commentary approach, with the “Economic accounts” chapter introduction reading, “Until 2008, Canada had gone a record 16 years since its last economic downturn and had been riding a seven-year boom in commodity prices. But the economy in 2008 was unlike any in recent memory. For many younger workers and investors, 2008 was their first experience with a recession.” While younger Canadians were experiencing their first economic downtown in 2009, they were also disproportionately “browsing, blogging, chatting, and downloading” compared to other Canadians as the “Information and communications technology” chapter details (and at the high speed of 5-9 mbps!). If you can believe it, StatsCan mentions 500 internet service providers operating in Canada at the time!
These are such digestible and interesting accounts of Canadian history, and it’s a shame this time capsule series has been discontinued!
Canadian Coin Issuance
The Royal Canadian Mint has a website that contains all the numbers for the mintages for various Canadian coins. You can go, learn about the histories of each coin type and then see how many coins were issued every year. Unfortunately none of this data is in an easy to consume format, but never fear, Mean, Median, and Moose are here with their document.querySelectAll() super powers. You can find an easy to consume CSV file and some graphs with the numbers on the Observable notebook here.
So, what does this have to do with discontinued data sets? Well, this is a data set about something that was discontinued – the penny – but the data set is alive and well. See what we did there? The last penny was minted in 2012, but before that it constituted the bulk of Canadian minting in terms of number of coins:
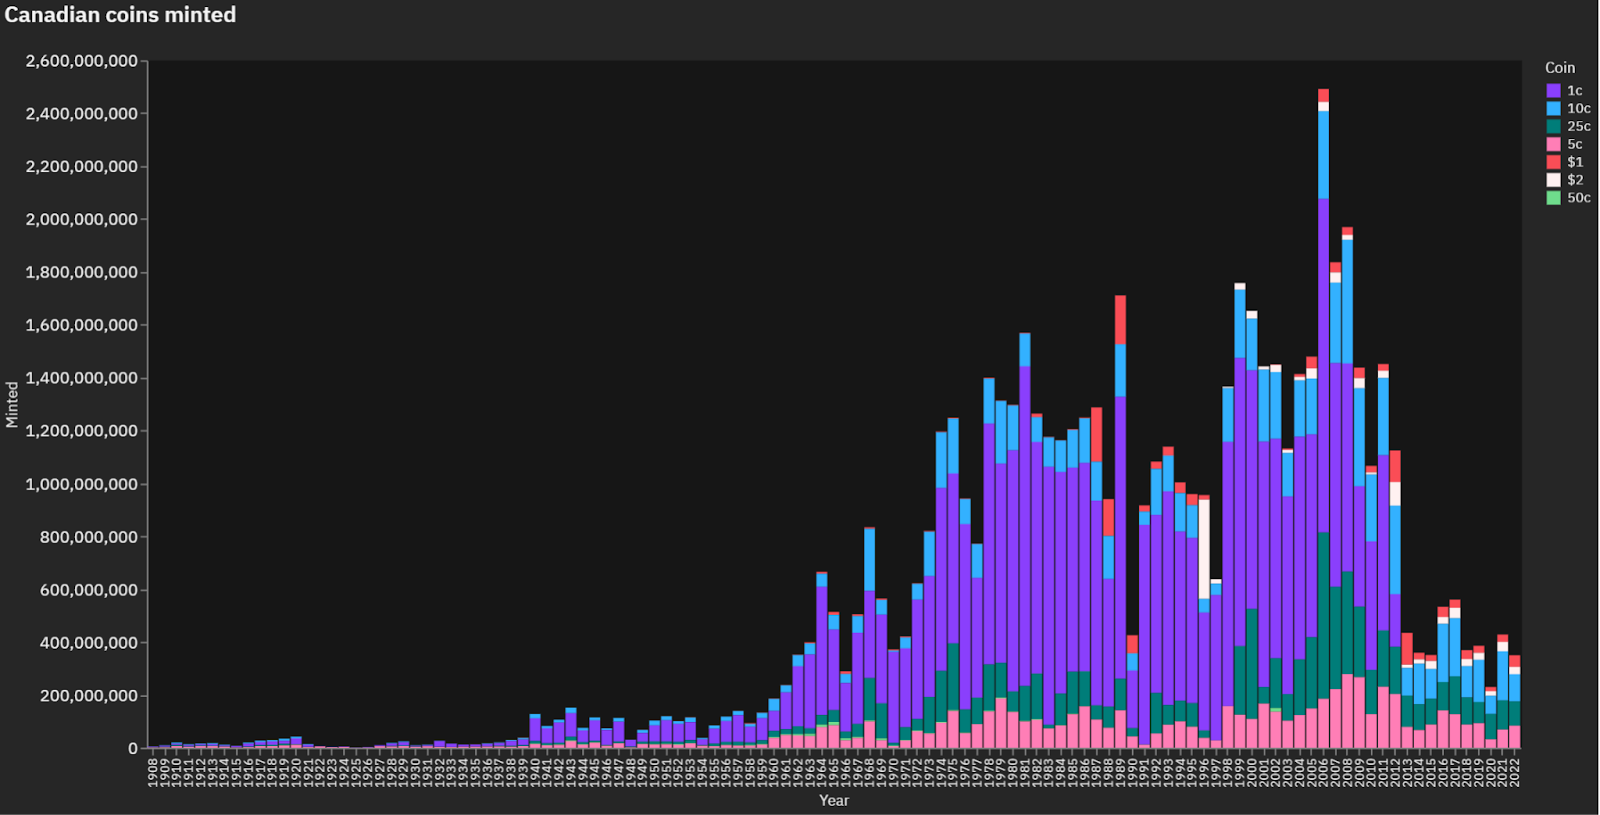
The youngsters or new immigrants reading this might also be interested to know that the toonie is a modern invention, making its first appearance in 1996:
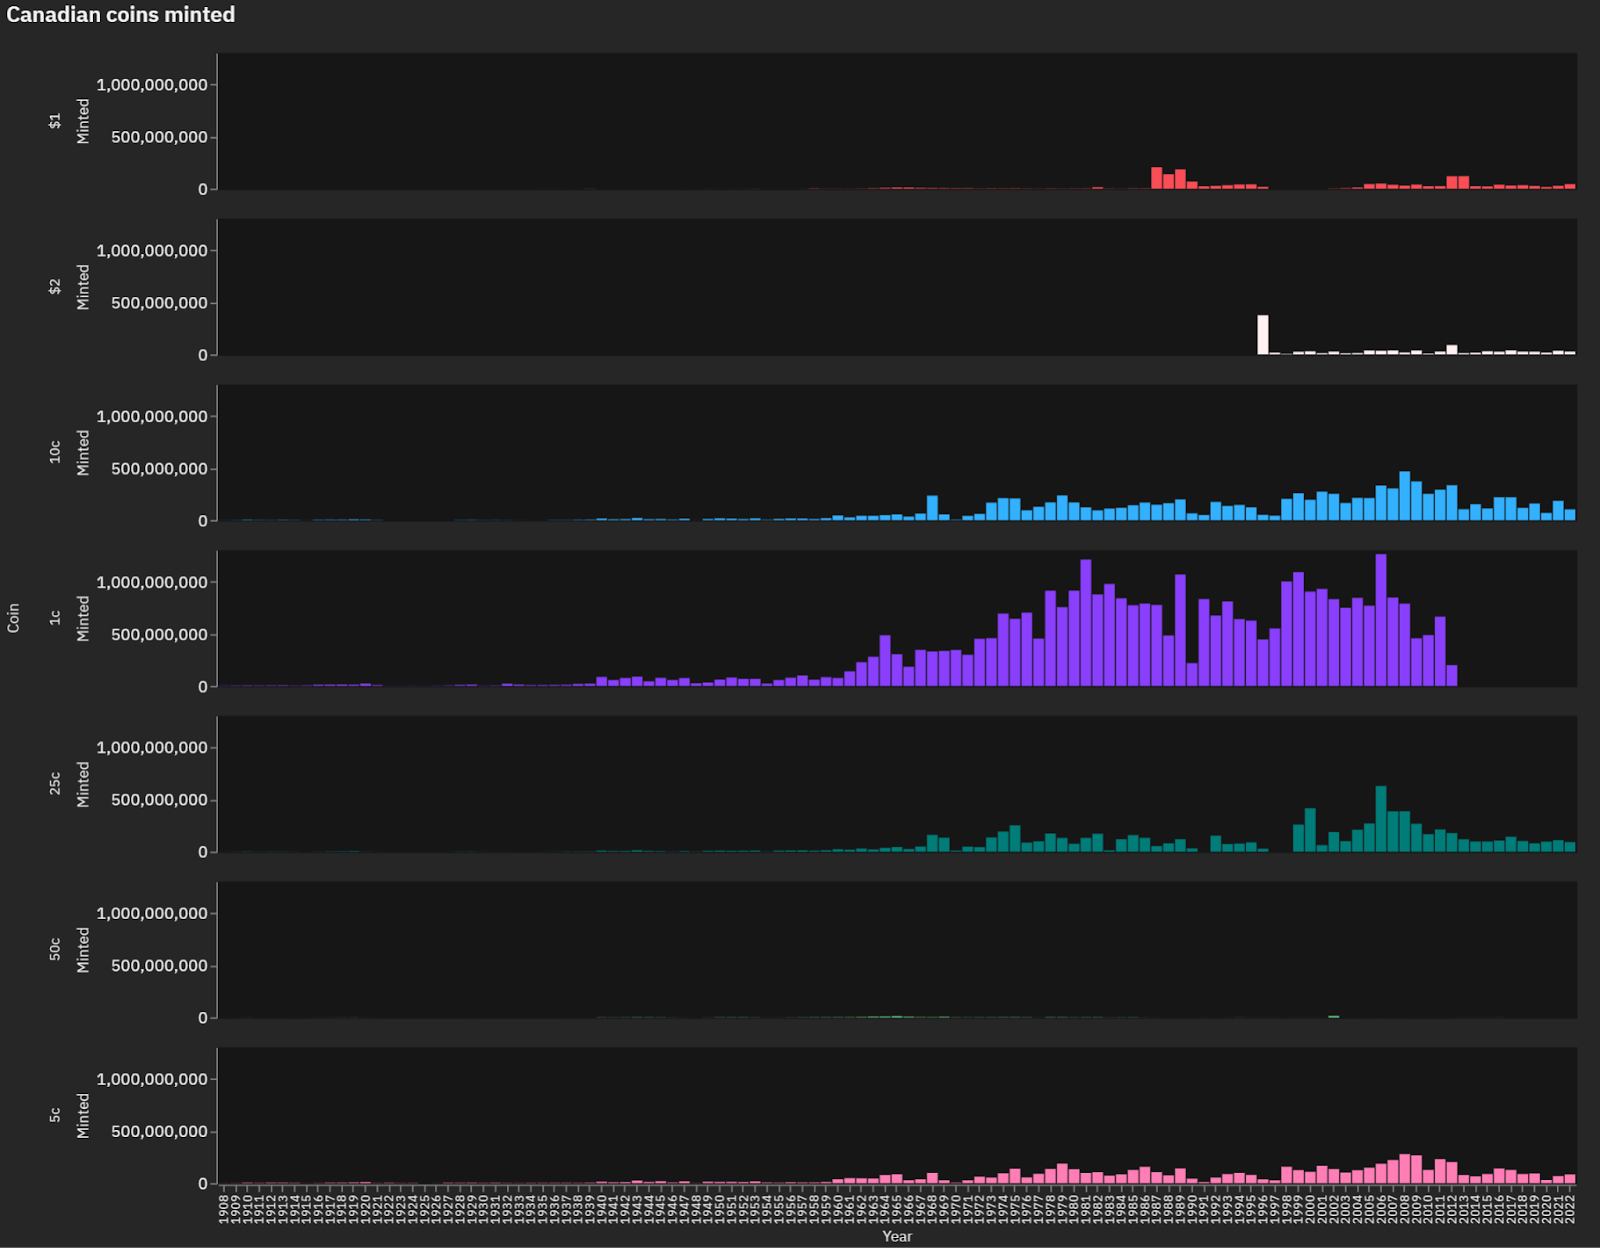
You might also be interested to know that the loonie was not substantially minted until 1987. Doug still yearns for the old school $1 bill but will have to settle for crossing the border to see one in the modern age.
Speaking of that initial mintage of the toonie in 1996, you can see that it’s a big one. So large that, in terms of face value, that year dwarfs all others:
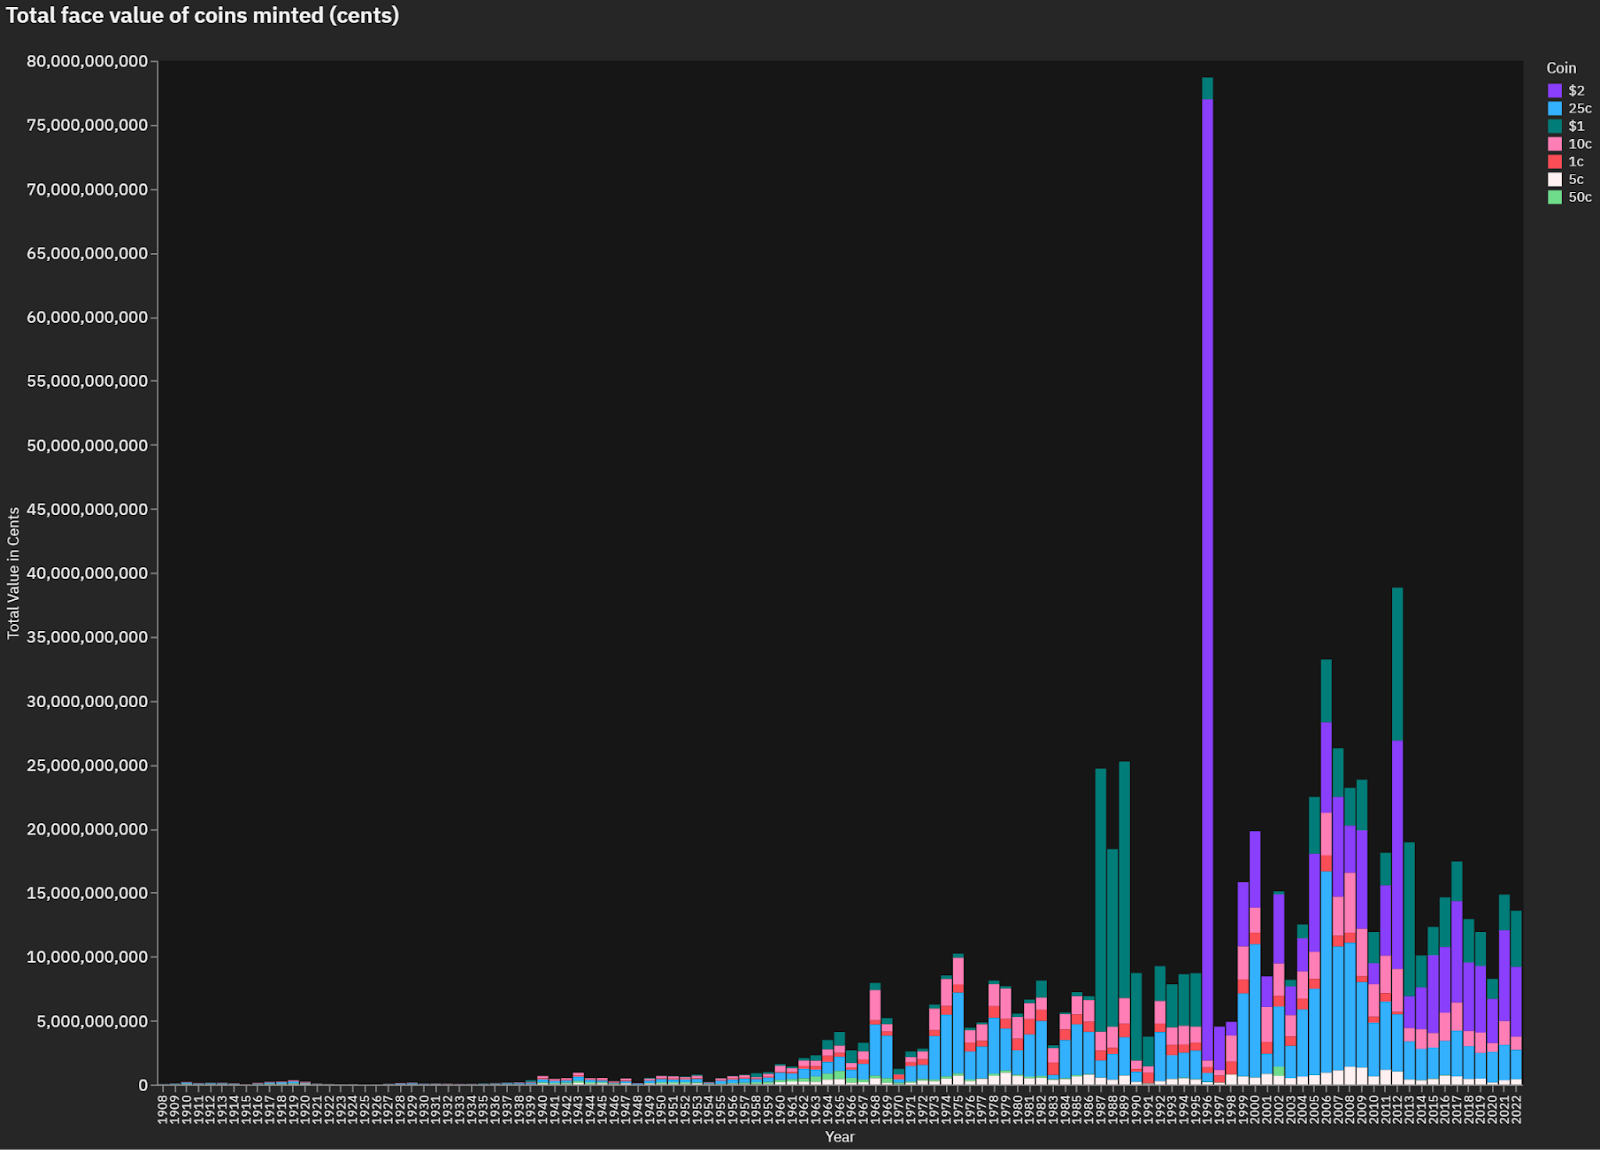
$2 being worth 200 pennies makes that bar the biggest by far. If you look at the coin and value numbers in general though you can see there’s been a big reduction since about 2013 even though the economy is larger. As you’ve probably guessed, there’s a lot less coins being issued since we do fewer and fewer transactions with hard currency.
Reporting and Trends on Data Gaps
There are literally dozens of discontinued Statistics Canada datasets that I could talk about: ending of annualized tracking of marriage and divorce rates; to shifts in Census methodologies; to more eclectic data sets like Salaries and salary scales of full-time teaching staff at Canadian universities ending. To reliability issues emerging in critical economic surveys: here in 2016 and here in 2023 as fewer Canadians complete the surveys.
Statistics Canada actually has a page where they answer some common questions on “Does Statistics Canada Collect this information”. Some of these data items are certainly “nice to have” – dog and cat pet data or the proportion of the population that is vegetarian or vegan. Others seem more critical – stats on abortion rates, homelessness, classroom sizes in schools.
Reporting was done by the Globe and Mail in 2019. As part of a broader series on comparing Canada’s data landscape to other countries, they created an interactive tool for readers to ask their data questions, they identified 30 gaps in 2019 – ranging from how many people live in Nursing homes in Canada (Statistics Canada doesn’t know and there is no centralized count) to Eviction rates (they looked at an innovative student from Princeton as a potential pathway forward.
Statistics Canada 2022-23 Department Results report breakdowns the activities and costs the Statistics Canada undertook in a particular year. To a degree this kind of replaces some of the year books that Katie was talking about as the documents breakdown by different topic areas a summary of reports and studies that were accomplished as well as a few meta-narratives. With over 30+ pages dedicated covering the core services this annual document is not lean on what they covered.
More interestingly they breakdown their spending and the led me to noticing acknowledgements like this recent study by Statistics Canada had this under its title.

The study on Food Insecurity in Canada was released in November of 2023 uses data from the 2021 Canadian Income Survey to gain a better understanding of food insecurity, with a focus on families both below and above the poverty line and across income quintiles. The study also uses data from the 2019 Survey of Financial Security to examine the net worth of families who are more likely to be food insecure. Now sponsorship and cost recovery isn’t completely new for Statistics Canada.
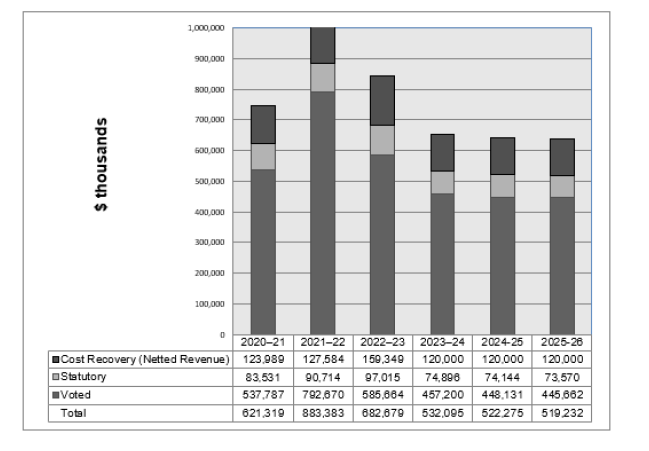
That being said, the question you have to ask is when over $500 million per year in revenue why are there still data gaps?
Census of New France, 1665-1666
Although there are still censuses in Canada, we count this one as a discontinued data set because the French colony of Canada as a component of New France ceased to exist in 1763. The Borealis data repository is an academic data repository in Canada. The repository hosts a collection of pre-Confederation census data that is available to the public. Though we didn’t make any maps this time around, there is historical GIS data available in this repository, which creates the potential for some really interesting data projects!
The first census in North America happened under the administration of Jean Talon, who was the Intendant of New France at the time. This was a newly-created position responsible for the entire civil administration of the colony, including statistical data. By instituting the first census and in some cases personally conducting the census door-to-door, Talon earns the title of the first official statistician in Canada.
We made an Observable notebook visualizing some key findings from the census, particularly the demographic information that led Talon to institute a program importing young French women to pair with unmarried colonists. This policy is deeply connected with another element that will strike a modern viewer of this census data: there were certainly many thousands of residents of the territory called New France not counted in this census because they were indigenous people, and the “shortage” of women in New France was a consequence of French policy discouraging marriage between French settlers and the indigenous population.


We also included a heat map and data viewer for the fascinating data on professions and trades in New France. The list of occupations is interesting in itself – shoemakers are distinguished from wooden shoemakers, an important enough difference in 1665 for there to be two categories. The biggest categories are “Carpenter”, with 35 people following this trade in the colony and “Servants,” with dozens of servants in every region. Another notable category is “Gentlemen of Leisure,” of which 15 resided in Quebec at this time.

10 episodes