The iFanboy.com Comic Book Podcast is a weekly talk show all about the best new current comic book releases. Lifelong friends, Conor Kilpatrick and Josh Flanagan talk about what they loved and (sometimes) hated in the current weekly books, from publishers like Marvel, DC, Image Comics, Dark Horse Comics, BOOM! Studios, IDW, Aftershock, Valiant, and more. The aim is to have a fun time, some laughs, but to also really understand what makes comic books work and what doesn’t, and trying to under ...
…
continue reading
Content provided by Enrico Bertini and Moritz Stefaner, Enrico Bertini, and Moritz Stefaner. All podcast content including episodes, graphics, and podcast descriptions are uploaded and provided directly by Enrico Bertini and Moritz Stefaner, Enrico Bertini, and Moritz Stefaner or their podcast platform partner. If you believe someone is using your copyrighted work without your permission, you can follow the process outlined here https://player.fm/legal.
Similar to Data Stories
Welcome to the FroKnowsPhoto Podcast where we discuss all things Photography. From Nikon to Canon Cameras and all the lenses and accessories for your camera bag. If you are into photography looking to pick up tips, tricks, reviews and our personal views than this is the podcast for you. Please subscribe for the latest episodes.
…
continue reading
Every creative work you’ve ever loved has a hero’s journey behind it. On Spark & Fire, you'll hear creators tell the story of bringing one beloved work to life. Iconic creatives — like Wicked composer Stephen Schwartz, Pixar director Domee Shi, comedian Patton Oswald, musician Wynton Marsalis, and novelist Isabel Allende — share the endless iterations, the inevitable setbacks, and the breakthrough ideas along the epic process of creation. But this isn’t an interview show. It’s a story — told ...
…
continue reading
A podcast about web design and development.
…
continue reading
The Modern Art Notes Podcast is a weekly, hour-long interview program featuring artists, historians, authors, curators and conservators. Pulitzer Prize-winning art critic Sebastian Smee called The MAN Podcast “one of the great archives of the art of our time.” When the US chapter of the International Association of Art Critics gave host Tyler Green one of its inaugural awards for criticism in 2014, it included a special citation for The MAN Podcast.
…
continue reading
A podcast about craft, career, and creativity from Proximity Media, the production company that helped bring you Creed III, Judas and the Black Messiah, Space Jam: A New Legacy, Black Panther: Wakanda Forever podcast and soundtrack, and more. New episodes every Sunday.
…
continue reading
The award-winning WIRED UK Podcast with James Temperton and the rest of the team. Listen every week for the an informed and entertaining rundown of latest technology, science, business and culture news. New episodes every Friday.
…
continue reading
Show notes are at https://stevelitchfield.com/sshow/chat.html
…
continue reading
Hanselminutes is Fresh Air for Developers. A weekly commute-time podcast that promotes fresh technology and fresh voices. Talk and Tech for Developers, Life-long Learners, and Technologists.
…
continue reading
Read along with the Sword and Laser book club! From classic science fiction to the latest gritty fantasy, we cover it. Subscribe for book discussions, author interviews, hot releases, and news from the genre fiction world!
…
continue reading
Player FM - Podcast App
Go offline with the Player FM app!
Go offline with the Player FM app!

))
137 | Visualizing Earth with Cameron Beccario
Fetch error
Hmmm there seems to be a problem fetching this series right now.
Last successful fetch was on April 13, 2024 12:35 (
What now? This series will be checked again in the next day. If you believe it should be working, please verify the publisher's feed link below is valid and includes actual episode links. You can contact support to request the feed be immediately fetched.
Manage episode 230237306 series 32120
Content provided by Enrico Bertini and Moritz Stefaner, Enrico Bertini, and Moritz Stefaner. All podcast content including episodes, graphics, and podcast descriptions are uploaded and provided directly by Enrico Bertini and Moritz Stefaner, Enrico Bertini, and Moritz Stefaner or their podcast platform partner. If you believe someone is using your copyrighted work without your permission, you can follow the process outlined here https://player.fm/legal.

[There are no ads on Data Stories because we’re listener-supported; please consider contributing to the show! Oh…and now Data Stories is on Instagram!]
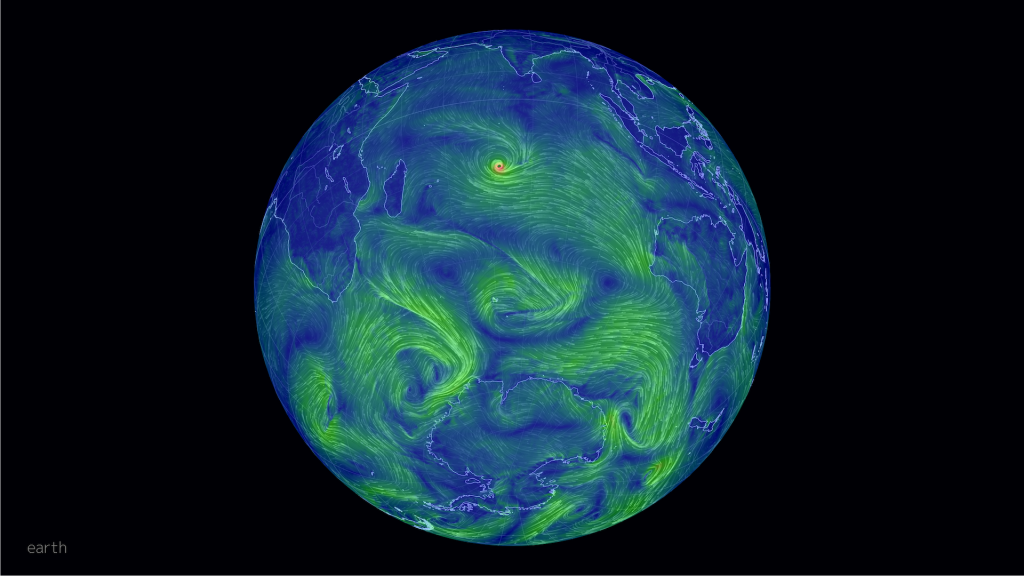
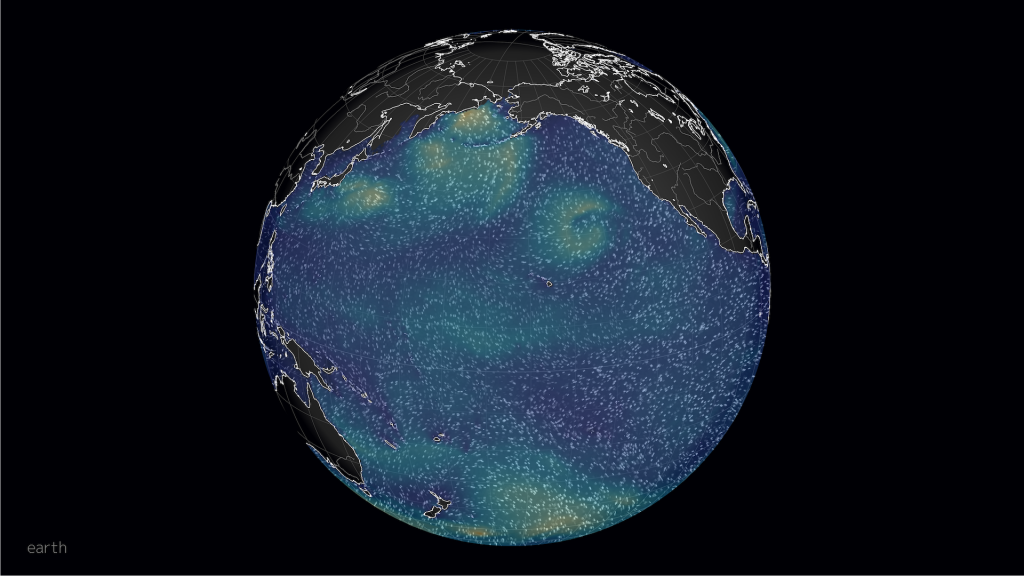
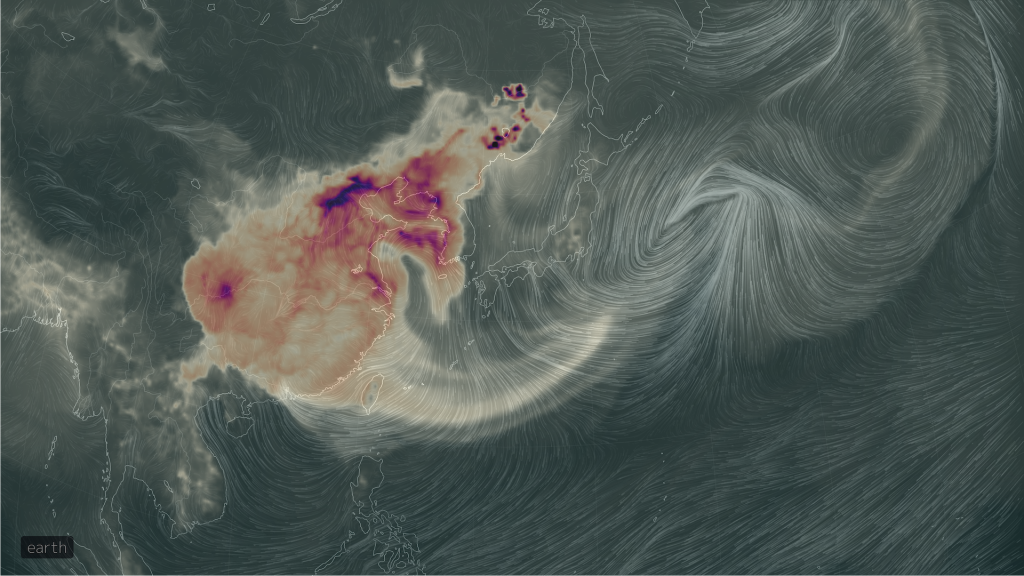
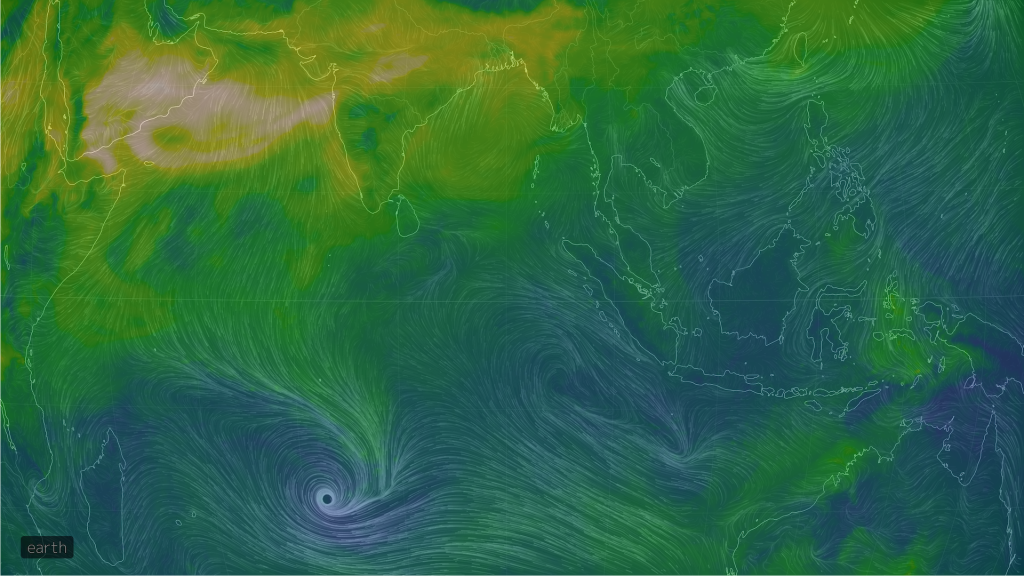
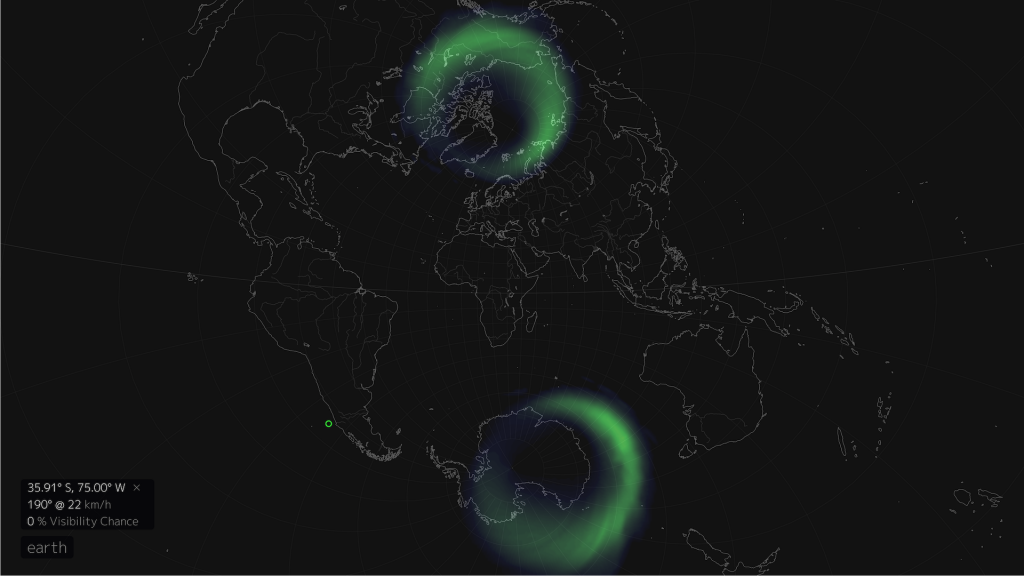
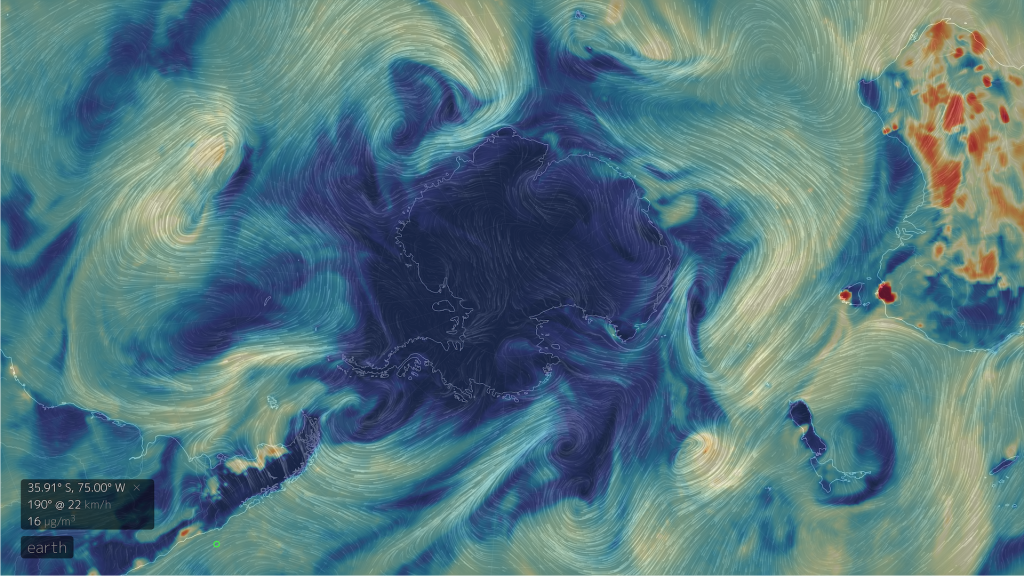
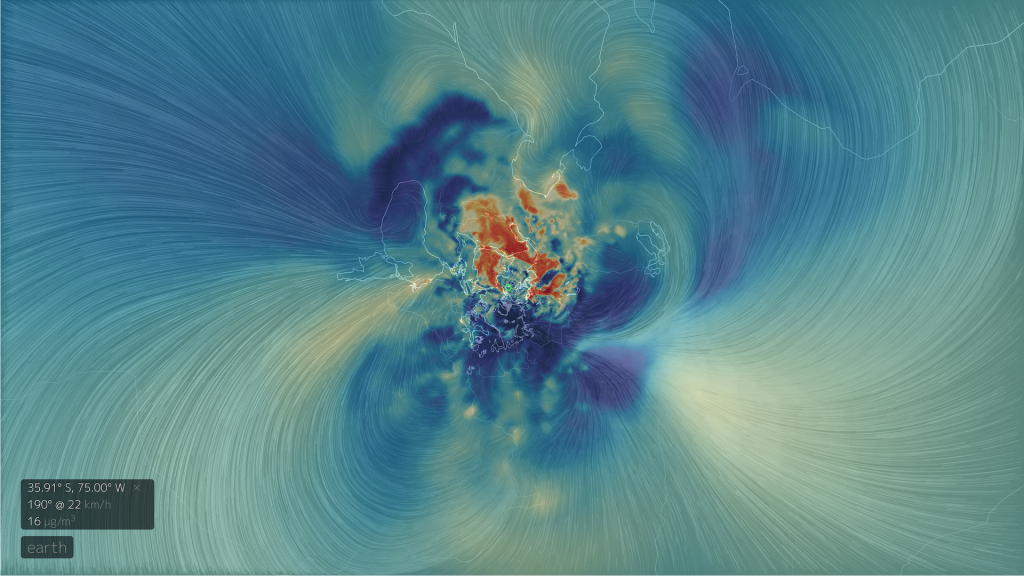
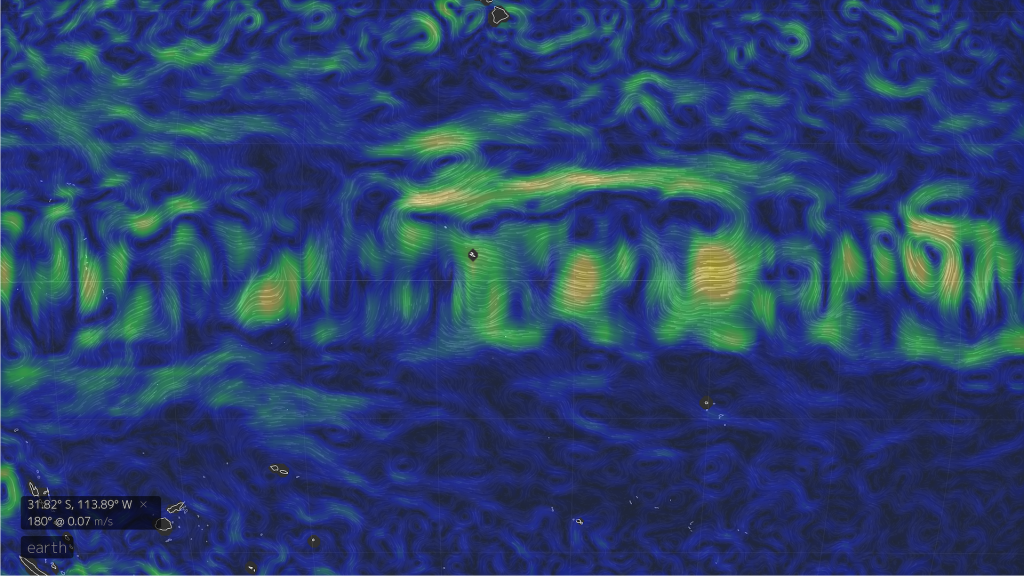
Today we are joined by Cameron Beccario who created the immensely impressive Earth visualization — a beautiful, geeky, mesmerizing look at the small blue marble we call home. On the show Cameron tells us all about the story behind the project, its evolution, and its reception — plus, at the end, we have a bonus chat about the state of data visualization in Japan.
Enjoy the show!
Links
- http://earth.nullschool.net
- Data Visualization Society
- Cameron’s Github repository
- Fernanda Viegas’ & Martin Wattenberg’s Wind Map
- Data Viz Japan
- Tohoku earthquake visualization
https://www.youtube.com/watch?v=obsw9qiBnjo
Chapters
1. Welcome back to Data Stories! (00:00:26)
2. There are no ads on Data Stories because we are listener-supported (00:01:13)
3. Check out the new Data Visualization Society! (00:01:50)
4. Introducing today's guest Cameron Beccario (00:02:45)
5. Cameron's visualization earth.nullschool.net (00:04:57)
6. The process for collecting this earth data (00:08:12)
7. The technology behind the project (00:12:22)
8. The reception of the project (00:16:23)
9. The future of the project (00:25:28)
10. Data Visualization in Japan (00:30:40)
11. Get in touch with us and support us on Patreon (00:34:39)
173 episodes
Fetch error
Hmmm there seems to be a problem fetching this series right now.
Last successful fetch was on April 13, 2024 12:35 (
What now? This series will be checked again in the next day. If you believe it should be working, please verify the publisher's feed link below is valid and includes actual episode links. You can contact support to request the feed be immediately fetched.
Manage episode 230237306 series 32120
Content provided by Enrico Bertini and Moritz Stefaner, Enrico Bertini, and Moritz Stefaner. All podcast content including episodes, graphics, and podcast descriptions are uploaded and provided directly by Enrico Bertini and Moritz Stefaner, Enrico Bertini, and Moritz Stefaner or their podcast platform partner. If you believe someone is using your copyrighted work without your permission, you can follow the process outlined here https://player.fm/legal.
[There are no ads on Data Stories because we’re listener-supported; please consider contributing to the show! Oh…and now Data Stories is on Instagram!]
Today we are joined by Cameron Beccario who created the immensely impressive Earth visualization — a beautiful, geeky, mesmerizing look at the small blue marble we call home. On the show Cameron tells us all about the story behind the project, its evolution, and its reception — plus, at the end, we have a bonus chat about the state of data visualization in Japan.
Enjoy the show!
Links
- http://earth.nullschool.net
- Data Visualization Society
- Cameron’s Github repository
- Fernanda Viegas’ & Martin Wattenberg’s Wind Map
- Data Viz Japan
- Tohoku earthquake visualization
https://www.youtube.com/watch?v=obsw9qiBnjo
Chapters
1. Welcome back to Data Stories! (00:00:26)
2. There are no ads on Data Stories because we are listener-supported (00:01:13)
3. Check out the new Data Visualization Society! (00:01:50)
4. Introducing today's guest Cameron Beccario (00:02:45)
5. Cameron's visualization earth.nullschool.net (00:04:57)
6. The process for collecting this earth data (00:08:12)
7. The technology behind the project (00:12:22)
8. The reception of the project (00:16:23)
9. The future of the project (00:25:28)
10. Data Visualization in Japan (00:30:40)
11. Get in touch with us and support us on Patreon (00:34:39)
173 episodes
All episodes
×Welcome to Player FM!
Player FM is scanning the web for high-quality podcasts for you to enjoy right now. It's the best podcast app and works on Android, iPhone, and the web. Signup to sync subscriptions across devices.
Similar to Data Stories
The iFanboy.com Comic Book Podcast is a weekly talk show all about the best new current comic book releases. Lifelong friends, Conor Kilpatrick and Josh Flanagan talk about what they loved and (sometimes) hated in the current weekly books, from publishers like Marvel, DC, Image Comics, Dark Horse Comics, BOOM! Studios, IDW, Aftershock, Valiant, and more. The aim is to have a fun time, some laughs, but to also really understand what makes comic books work and what doesn’t, and trying to under ...
…
continue reading
Welcome to the FroKnowsPhoto Podcast where we discuss all things Photography. From Nikon to Canon Cameras and all the lenses and accessories for your camera bag. If you are into photography looking to pick up tips, tricks, reviews and our personal views than this is the podcast for you. Please subscribe for the latest episodes.
…
continue reading
Every creative work you’ve ever loved has a hero’s journey behind it. On Spark & Fire, you'll hear creators tell the story of bringing one beloved work to life. Iconic creatives — like Wicked composer Stephen Schwartz, Pixar director Domee Shi, comedian Patton Oswald, musician Wynton Marsalis, and novelist Isabel Allende — share the endless iterations, the inevitable setbacks, and the breakthrough ideas along the epic process of creation. But this isn’t an interview show. It’s a story — told ...
…
continue reading
A podcast about web design and development.
…
continue reading
The Modern Art Notes Podcast is a weekly, hour-long interview program featuring artists, historians, authors, curators and conservators. Pulitzer Prize-winning art critic Sebastian Smee called The MAN Podcast “one of the great archives of the art of our time.” When the US chapter of the International Association of Art Critics gave host Tyler Green one of its inaugural awards for criticism in 2014, it included a special citation for The MAN Podcast.
…
continue reading
A podcast about craft, career, and creativity from Proximity Media, the production company that helped bring you Creed III, Judas and the Black Messiah, Space Jam: A New Legacy, Black Panther: Wakanda Forever podcast and soundtrack, and more. New episodes every Sunday.
…
continue reading
The award-winning WIRED UK Podcast with James Temperton and the rest of the team. Listen every week for the an informed and entertaining rundown of latest technology, science, business and culture news. New episodes every Friday.
…
continue reading
Show notes are at https://stevelitchfield.com/sshow/chat.html
…
continue reading
Hanselminutes is Fresh Air for Developers. A weekly commute-time podcast that promotes fresh technology and fresh voices. Talk and Tech for Developers, Life-long Learners, and Technologists.
…
continue reading
Read along with the Sword and Laser book club! From classic science fiction to the latest gritty fantasy, we cover it. Subscribe for book discussions, author interviews, hot releases, and news from the genre fiction world!
…
continue reading
Player FM - Podcast App
Go offline with the Player FM app!
Go offline with the Player FM app!


